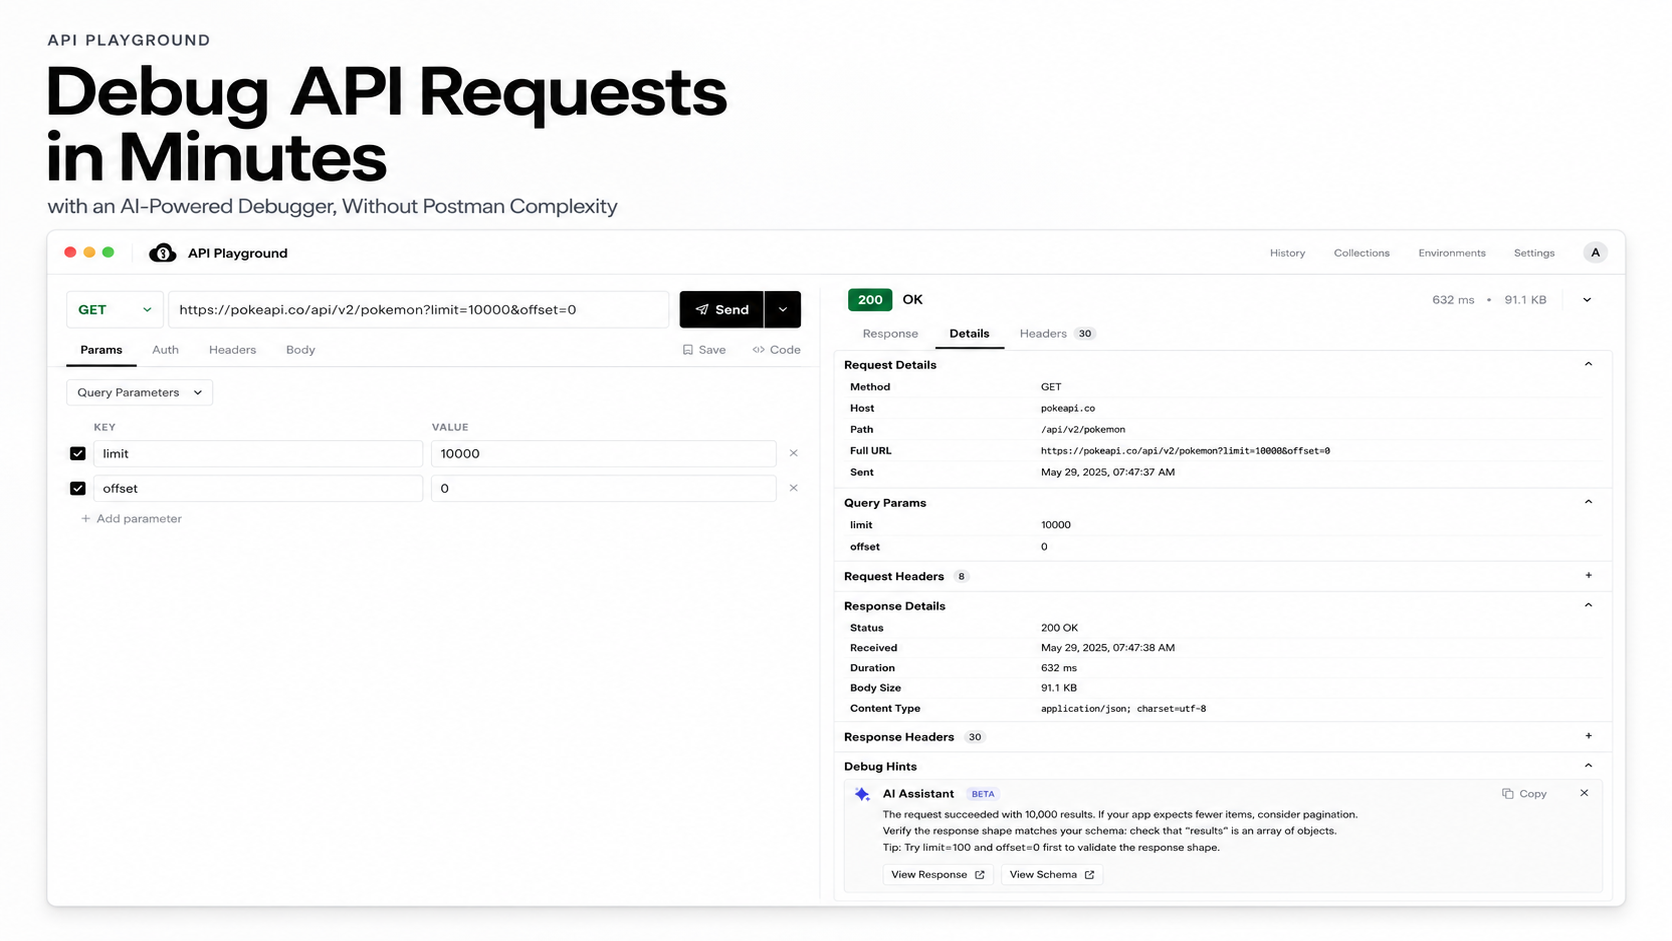
Debug API Requests in Minutes with an AI-Powered Debugger, Without Postman Complexity
Debug failed API requests in minutes with AI Agent Mode, response details, headers, payloads, and fix hints without Postman complexity.
Published June 29, 2026
Debug failed API requests in minutes: playgroundapi.com gives you AI Agent Mode plus a complete debug view for responses, headers, payloads, auth issues, and fix hints.
#Quick Verdict (TL;DR)
| What this guide covers | A faster, AI-powered workflow for debugging failed API requests |
| Who it is for | Developers, QA engineers, students, and builders testing REST APIs |
| Most common mistake | Starting in the code before reading the response carefully |
| Best first move | Inspect the status code, error body, and response headers |
| Fastest workflow | Reproduce the request in API Playground, inspect one debug view, then let Agent Mode help reason through the failure |
| Goal | Find the request, auth, payload, header, or environment issue without Postman complexity |
#Key Insights
- A broken API response is usually not random. The status code, headers, payload, and response body often tell you where to look first.
- Most API debugging problems come from a small set of causes: wrong method, wrong URL, bad auth, missing headers, malformed JSON, invalid parameters, permissions, or environment mismatch.
- Debugging gets slower when you change five things at once. The fastest path is to inspect the full request/response evidence in one place, then isolate one variable at a time.
- API Playground is useful for this because it pairs AI Agent Mode with a detailed debug view, so the agent can help reason through what happened while you inspect the same evidence yourself.
#The Problem: "The API Is Broken" Is Not a Diagnosis
You send a request. The response comes back wrong.
Maybe it is a 401 Unauthorized. Maybe the body is empty. Maybe you expected JSON and got an HTML error page. Maybe the endpoint worked yesterday, but today it returns a 500 Internal Server Error and the only message is:
{
  "error": "Something went wrong"
}
That moment is where API debugging often turns messy. You start checking your code, then the docs, then your token, then the request body, then the backend logs if you have access to them. Ten minutes later, you have changed the URL, renamed a field, regenerated the API key, and toggled environments. Now the original problem is buried under six new variables.
The better approach is simpler:
- Start with the response.
- Verify the request you actually sent.
- Isolate whether the issue is your request, the API, or the environment.
That is the whole debugging loop.
#5 Mistakes That Make API Debugging Take Hours
Before we walk through the three steps, it is worth naming the mistakes that make API debugging feel chaotic.
Broken endpoints are frustrating because they often look like front-end bugs. Your UI crashes, your fetch call throws, and the first instinct is to stare at the component that failed. But many API bugs are not front-end logic problems at all. They are simple request mismatches: a missing header, a silent non-200 response, a stale token, or a payload that is not actually being transmitted the way you think it is.
Here are the five mistakes to stop making.
#1. Trusting the Request You Wrote Instead of the Request You Sent
You might think your JSON payload is perfect. But if the Content-Type header is missing, or accidentally set to text/plain, the server may reject the request before it even looks at your data.
That is why the actual network trace matters more than the code you intended to run. What you wrote in fetch, Axios, or your front-end client is not always what reaches the server after headers, auth, proxies, environments, and browser behavior are applied.
In API Playground, the Details view helps you inspect the final request URL, query params, outgoing headers, payload, response status, and response headers in one place. That is the evidence you need before changing code.
#2. Treating Every Non-200 Response Like a Generic Failure
Treating every failed request as "the API is broken" wastes time. The server is usually telling you what went wrong in the response body.
A 401 points toward authentication. A 403 points toward permissions. A 404 points toward the route, version, or resource ID. A 422 usually means your JSON was understood, but the fields did not pass validation.
Your front-end code should not collapse all of those into the same generic error. Map important HTTP status codes to specific validation and UI states so your app reacts intelligently instead of crashing.
#3. Ignoring the Raw Error Object Before It Hits catch
Many developers only look at the thrown error. By then, useful details may already be hidden.
Inspect the raw JSON error object first. Look for missing fields, type mismatches, validation arrays, request IDs, and provider-specific error codes. Those details often explain the real culprit faster than the exception message does.
This is exactly where an AI-powered debugger helps. Agent Mode can read the same response body, headers, status code, and request details, then translate the failure into a likely fix in plain English.
#4. Repeating Manual Retries Instead of Editing and Replaying Cleanly
Manual retries are slow when every attempt requires changing code, refreshing the app, reproducing the UI state, and hoping the same request fires again.
A better workflow is to isolate the failing request, edit the URL, headers, query params, or payload directly, and send it again. That lets you see how the server responds to one controlled change at a time.
This also helps you simulate edge cases before production: missing fields, bad tokens, invalid IDs, server timeouts, rate limits, and empty responses. Your goal is not just to make one request pass. Your goal is to build front-end error boundaries that stay resilient when the API behaves badly.
#5. Using Static IDs, Expired Tokens, and Manual Copy-Paste State
One of the most common traps is testing with static IDs or tokens that eventually expire. Then you start chasing false bugs that have nothing to do with your application logic.
Professional API debugging uses fresh, context-aware request state. Environment variables keep base URLs and secrets separate. Dynamic request chaining lets a login response, create call, or generated ID feed into the next request instead of forcing you to copy and paste values manually.
For more advanced APIs, pre-flight logic can generate timestamps, signatures, nonces, and authentication headers before the request is sent. That matters when every outbound request must be cryptographically valid.
The goal is to replace guess-and-check debugging with a repeatable local-first workflow. When your team can inspect the same request details, use shared environments, and reproduce failures consistently, API bugs get caught in development before they reach users.
#Step 1: Start With the Response
Before touching your code or rewriting the request, look at what the server already gave you. A broken API response usually contains three clues: the status code, the response body, and the response headers.
#Read the Status Code First
The status code tells you the category of failure. It does not always tell you the exact fix, but it gives you the first direction.
| Status code | What it usually means | Where to look first |
|---|---|---|
400 Bad Request | The request is malformed | Query params, JSON body, required fields |
401 Unauthorized | Authentication failed | Missing token, expired token, wrong API key |
403 Forbidden | Authentication worked, but permission failed | Scopes, roles, account access, workspace permissions |
404 Not Found | Endpoint or resource was not found | URL path, route version, resource ID |
409 Conflict | Request conflicts with current state | Duplicate records, state transitions, idempotency |
422 Unprocessable Entity | Request was valid JSON but failed validation | Field names, data types, formats, required values |
429 Too Many Requests | Rate limit was hit | Retry timing, rate limit headers, request volume |
500 Internal Server Error | Server failed while processing | API provider issue, backend bug, unexpected input |
The biggest trap is treating all failures the same. A 401 and a 422 need completely different debugging paths. A 401 says, "Prove who you are." A 422 says, "I understood the request, but the data does not pass validation."
#Read the Error Body Like a Clue Sheet
Many APIs include useful details in the response body, but the important part may be nested.
Look for fields like:
messageerrorerrorsdetaildetailscodefieldvalidation_errorsdocumentation_url
For example:
{
  "error": "validation_failed",
  "message": "The request body contains invalid fields.",
  "details": [
    {
      "field": "email",
      "issue": "Invalid email format"
    },
    {
      "field": "date_of_birth",
      "issue": "Expected YYYY-MM-DD"
    }
  ]
}
This is not just "the API failed." It tells you exactly which fields to inspect.
When the error body is vague, still save it. Backend teams and API providers often need the exact error payload, request ID, or timestamp to trace the issue.
#Check the Response Headers
Headers are easy to ignore because the response body feels more important. But headers often explain why the body looks wrong.
Important headers to check:
| Header | Why it matters |
|---|---|
content-type | Confirms whether the API returned JSON, HTML, text, or something else |
www-authenticate | Often explains auth failures |
retry-after | Tells you when to retry after a rate limit |
x-request-id | Helps backend teams trace the request |
x-ratelimit-remaining | Shows whether you are close to a rate limit |
location | Useful for redirects and created resources |
If you expected JSON but received text/html, you may be hitting a web route, proxy error page, login page, or CDN response instead of the API endpoint.
#Compare Expected vs Actual
Write down what you expected before guessing what broke.
Ask:
- Did I expect a
200,201, or204? - Did I expect JSON but receive HTML?
- Did I expect an array but receive an object?
- Did I expect a field that is missing?
- Did the API return a valid response with the wrong data?
- Did the response shape change from the docs?
This is where API Playground helps. You can inspect the status, headers, and formatted body in one place, then adjust the request and send it again without losing context.
#Step 2: Verify the Request You Actually Sent
Once you understand the response, inspect the request. Not the request you meant to send. The request you actually sent.
Small request mistakes create large debugging sessions.
#Confirm the URL and Method
Start with the basics:
- Is the base URL correct?
- Are you using the right environment: local, staging, or production?
- Is the API version correct, such as
/v1vs/v2? - Are path parameters filled in?
- Is the method correct:
GET,POST,PUT,PATCH, orDELETE? - Is there a trailing slash requirement?
This broken request looks close, but the method is wrong:
GET /v1/users HTTP/1.1
Host: api.example.com
Content-Type: application/json
If the endpoint expects a user creation payload, it may need:
POST /v1/users HTTP/1.1
Host: api.example.com
Content-Type: application/json
Method mismatches often produce confusing errors. Some APIs return 405 Method Not Allowed. Others return 404 to avoid exposing route details. A few return a generic 400.
#Inspect Auth and Headers
Authentication bugs are some of the most common API debugging issues.
Check:
- Is the
Authorizationheader present? - Is the token expired?
- Is the prefix correct, such as
Bearer? - Are you using the right API key for this environment?
- Does the token have the required scopes?
- Are you sending
Content-Type: application/jsonwhen sending JSON? - Are you sending
Accept: application/jsonif the API uses content negotiation?
Example:
Authorization: token abc123
Content-Type: application/json
If the API expects bearer auth, the correct header may be:
Authorization: Bearer abc123
Content-Type: application/json
That one missing word can turn a valid token into a 401.
#Validate Query Params and Body Fields
If the status code is 400 or 422, move quickly to parameters and body fields.
Common issues include:
- Missing required fields
- Wrong field names
- Wrong casing, such as
userIdvsuser_id - String values sent as numbers
- Numbers sent as strings
- Bad date formats
- Empty arrays where at least one item is required
- Invalid enum values
- Malformed JSON
Here is a classic example:
{
  "email": "sam@example.com",
  "dateOfBirth": "03/15/1995",
  "plan": "pro_plus"
}
The API may expect:
{
  "email": "sam@example.com",
  "date_of_birth": "1995-03-15",
  "plan": "pro"
}
Three small differences can break the response:
dateOfBirthshould bedate_of_birth03/15/1995should be1995-03-15pro_plusis not a valid plan enum
#Reproduce With the Smallest Possible Request
When a request is complicated, simplify it.
Start with the minimum request that should work. Remove optional headers, optional fields, filters, sorting, pagination, and extra metadata. Send a clean version first.
{
  "email": "sam@example.com",
  "date_of_birth": "1995-03-15"
}
If the minimal request works, add fields back one at a time. The field that breaks the response is your lead.
Changing one variable at a time is not glamorous, but it is fast.
#Step 3: Isolate the Root Cause
After you inspect the response and verify the request, the final question is:
Where is the problem actually coming from?
Most broken API responses fall into one of three buckets:
- Your request is wrong.
- The API is rejecting a valid request because of auth, permissions, or state.
- The environment or service is behaving differently than expected.
#Test With Known-Good Inputs
Use data that should definitely work:
- A user ID from the API docs
- A sample request from the documentation
- A resource you know exists
- A token that worked recently
- A simple public test endpoint
If known-good data works, your original payload or resource is likely the problem.
If known-good data fails too, the issue may be auth, environment, availability, or the API itself.
#Compare Environments
Environment mismatch causes subtle API bugs.
Check:
- Are you using a production API key against staging?
- Are you using staging IDs against production?
- Does the resource exist in this environment?
- Is the feature enabled in one environment but not another?
- Are the docs describing a newer API version than the one you are calling?
This is especially common when APIs have separate base URLs:
Local:      http://localhost:3000/api
Staging:    https://staging-api.example.com
Production: https://api.example.com
A valid production user ID may return 404 in staging because that user does not exist there.
#Check Permissions, Scopes, and Account State
A 403 Forbidden usually means the API knows who you are, but you are not allowed to perform the action.
Look for:
- Missing OAuth scopes
- Read-only API keys
- Workspace-level permissions
- Account plan limits
- Disabled resources
- User roles
- Organization or tenant mismatch
For example, this token may be valid:
{
  "sub": "user_123",
  "scopes": ["users:read"]
}
But this request needs write access:
POST /v1/users HTTP/1.1
Host: api.example.com
Authorization: Bearer abc123
The token is real. The request is formatted correctly. The response is still broken because the permission is wrong.
#Watch for Rate Limits and Timeouts
Not every broken response is caused by a bad request.
If failures are intermittent, check for:
429 Too Many Requests502 Bad Gateway503 Service Unavailable504 Gateway Timeout- Slow upstream services
- Large payloads
- Retry storms
- Network or proxy issues
Rate limit responses often include helpful headers:
HTTP/1.1 429 Too Many Requests
retry-after: 60
x-ratelimit-limit: 100
x-ratelimit-remaining: 0
In this case, editing the JSON body will not help. You need to slow down, retry later, or adjust the integration.
#Save the Evidence
When you cannot solve the problem alone, give the next person a complete debugging packet.
Include:
- Full URL without secrets
- HTTP method
- Request headers without secrets
- Request body
- Status code
- Response headers
- Response body
- Timestamp
- Environment
- Request ID or trace ID
- What you expected
- What actually happened
This turns "the API is broken" into a useful bug report.
#A Practical 3-Step Debugging Checklist
Use this checklist the next time an API response looks wrong.
#1. Inspect the Response
- Check the status code.
- Read the full error body.
- Look for nested validation errors.
- Inspect response headers.
- Compare expected vs actual data.
#2. Verify the Request
- Confirm the base URL and endpoint path.
- Confirm the HTTP method.
- Check auth headers and API keys.
- Check
Content-TypeandAccept. - Validate query params.
- Validate JSON body fields.
- Reproduce with a minimal request.
#3. Isolate the Cause
- Test with known-good data.
- Compare staging and production.
- Check scopes and permissions.
- Look for rate limits or timeouts.
- Save request and response evidence.
- Escalate with a clear reproduction.
#Example: Debugging a Pokemon API Request
Let's make this practical with a real public API.
The Pokemon API, commonly known as PokeAPI, is a good example because you can test it without signing up, creating a workspace, or generating an API key. That makes it perfect for learning the debugging workflow before you move on to APIs that require authentication.
Start with a simple request:
GET /api/v2/pokemon?limit=10000&offset=0 HTTP/1.1
Host: pokeapi.co
Accept: application/json
In API Playground, paste this full URL:
https://pokeapi.co/api/v2/pokemon?limit=10000&offset=0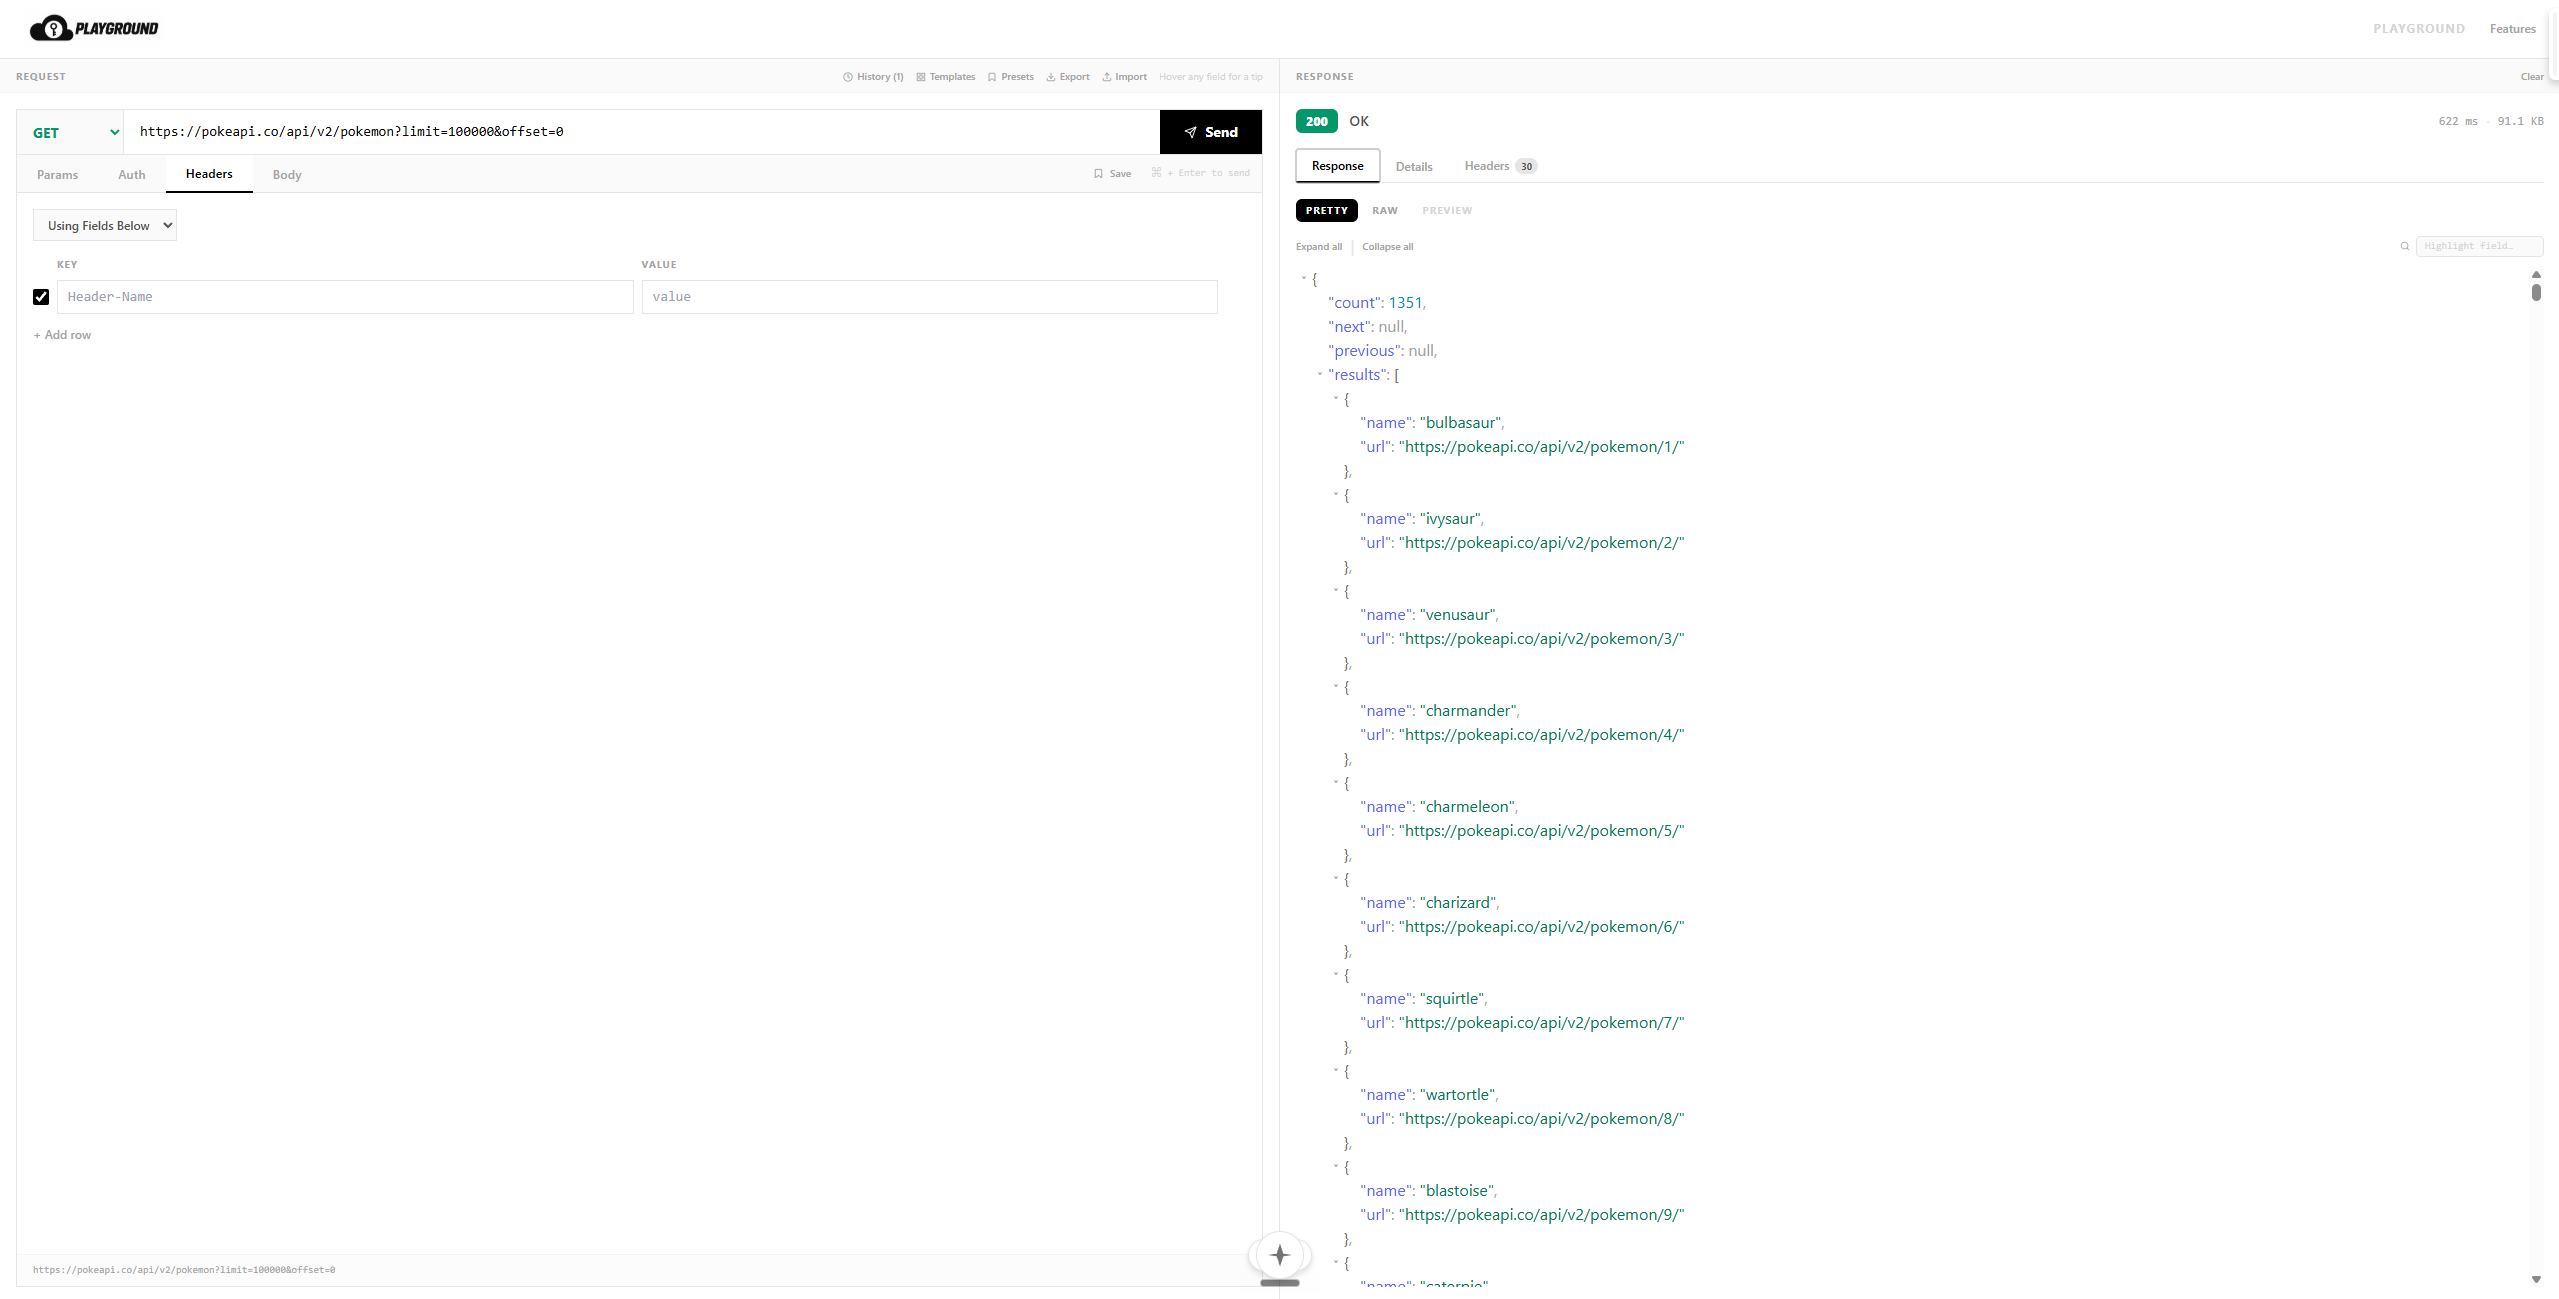
When the request succeeds, the response should look something like this:
{
  "count": 1351,
  "next": null,
  "previous": null,
  "results": [
    {
      "name": "bulbasaur",
      "url": "https://pokeapi.co/api/v2/pokemon/1/"
    }
  ]
}
Now open the debug details view and inspect the evidence:
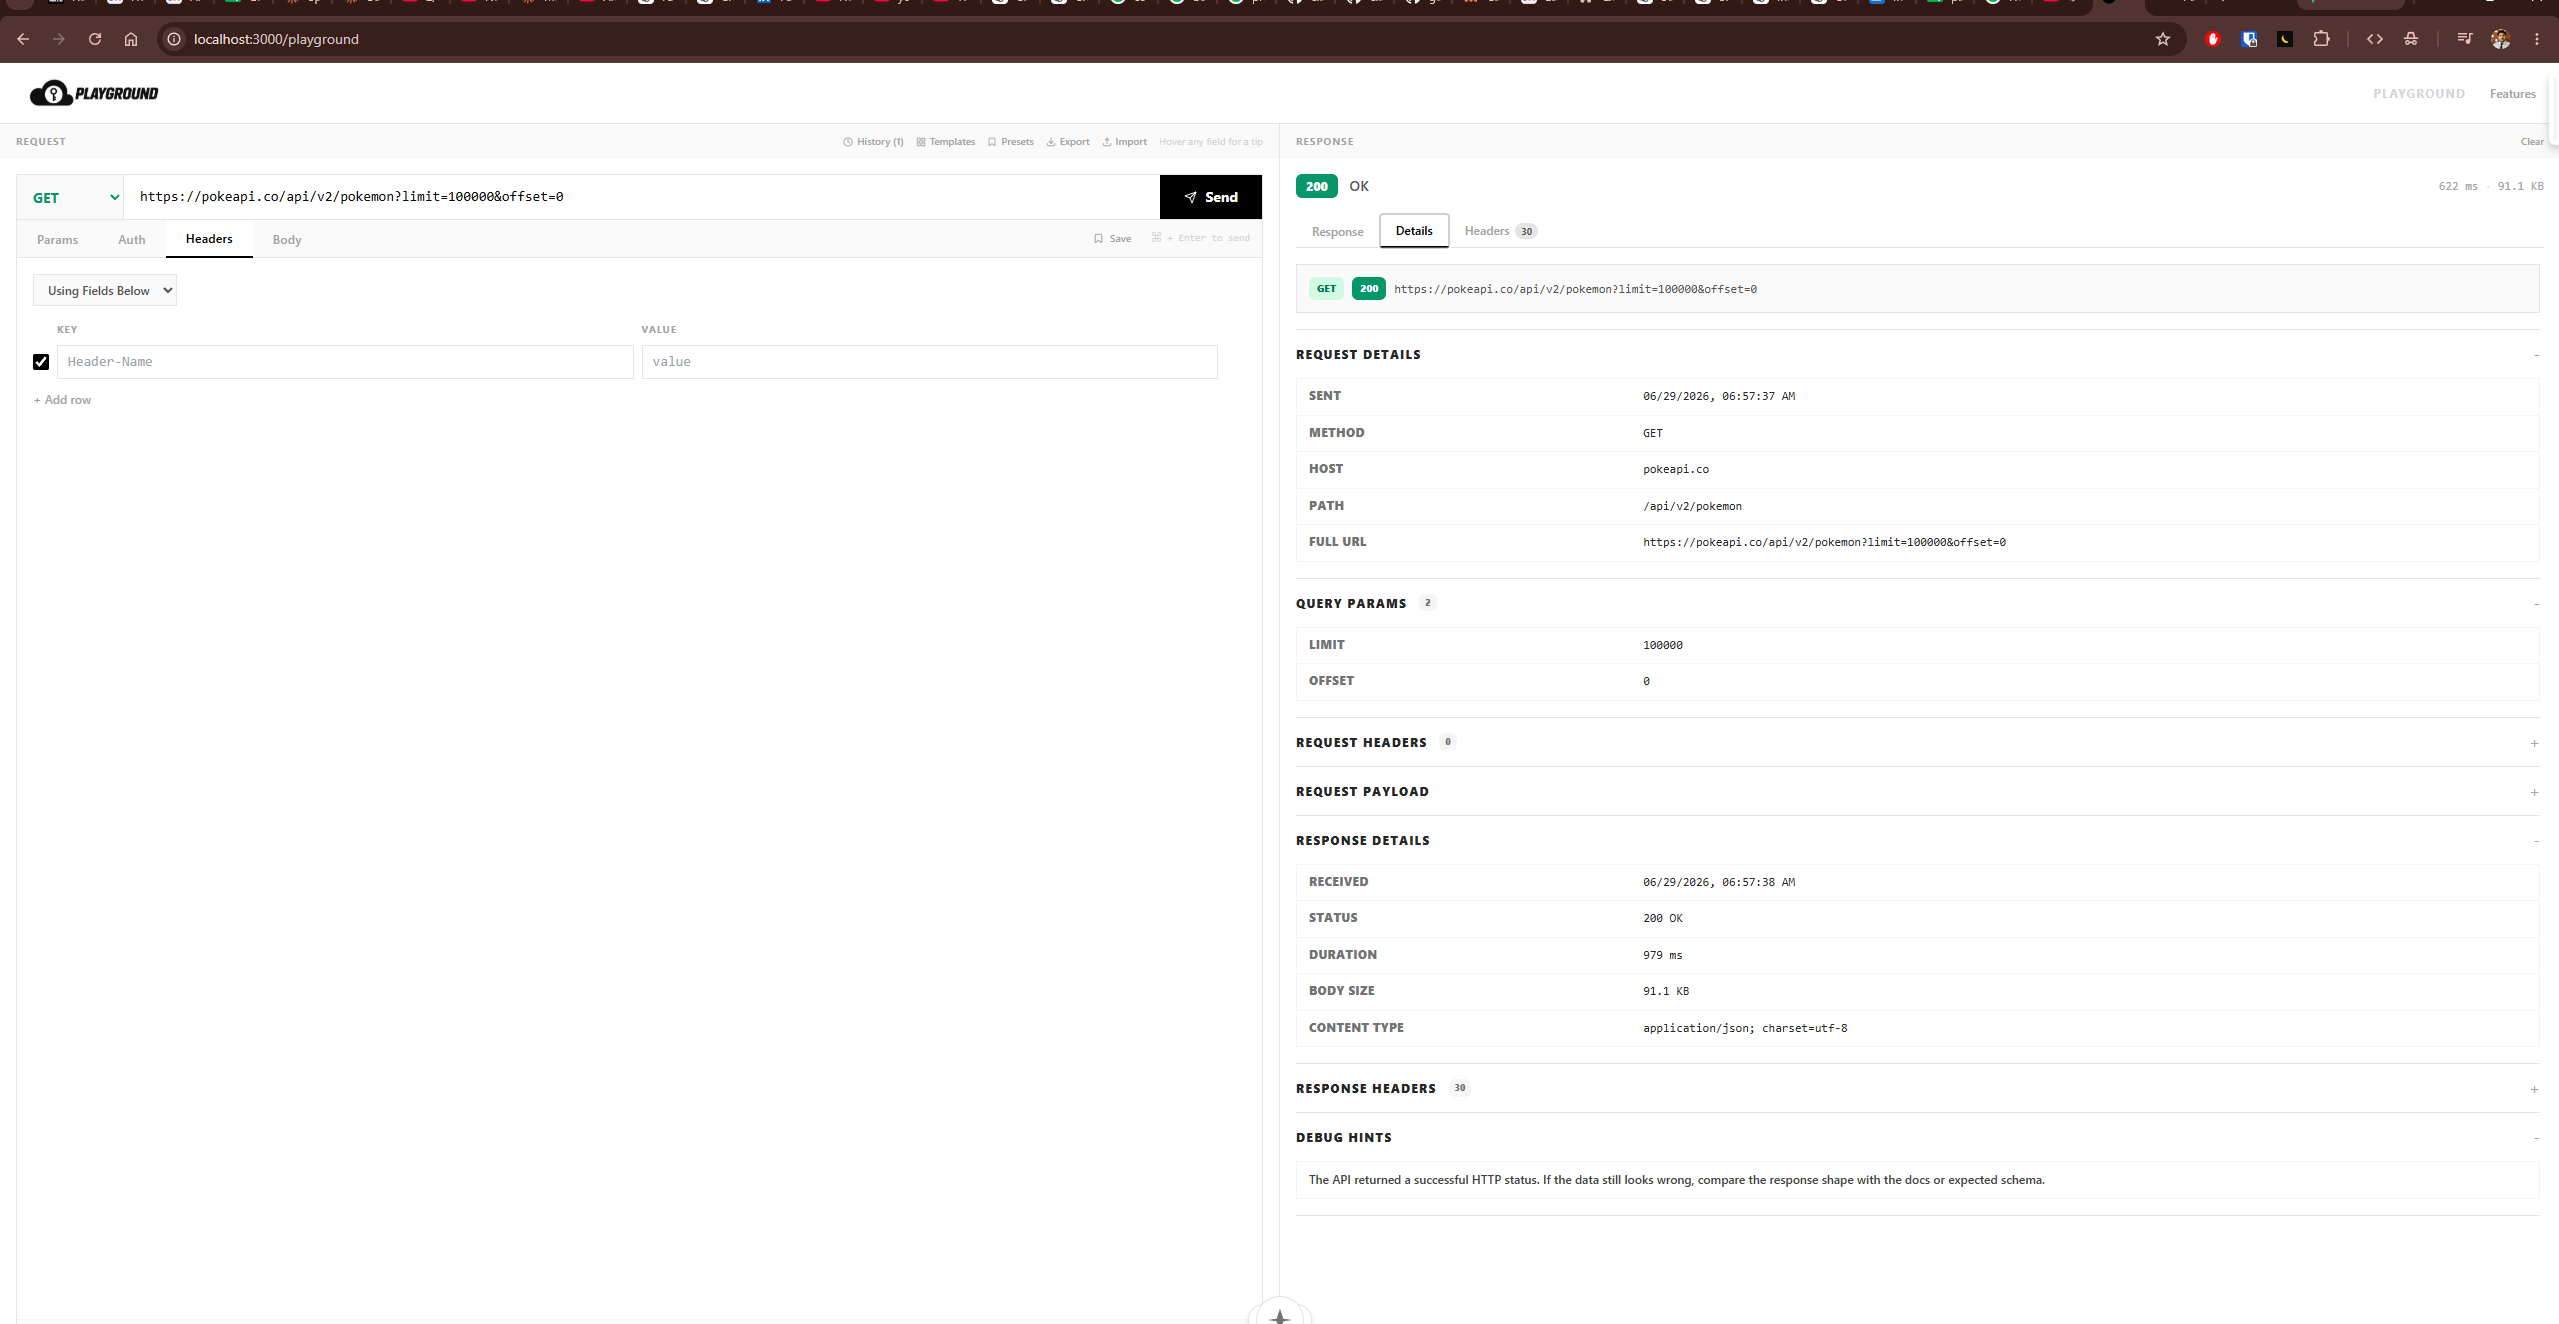
| Debug section | What you should see |
|---|---|
| Request Details | GET, host pokeapi.co, path /api/v2/pokemon |
| Query Params | limit set to 10000, offset set to 0 |
| Request Headers | Accept: application/json if you added it |
| Response Details | 200 OK, duration, body size, and content type |
| Response Headers | headers like content-type, cache headers, and server metadata |
| Debug Hints | a success note if the API returned a 2xx response |
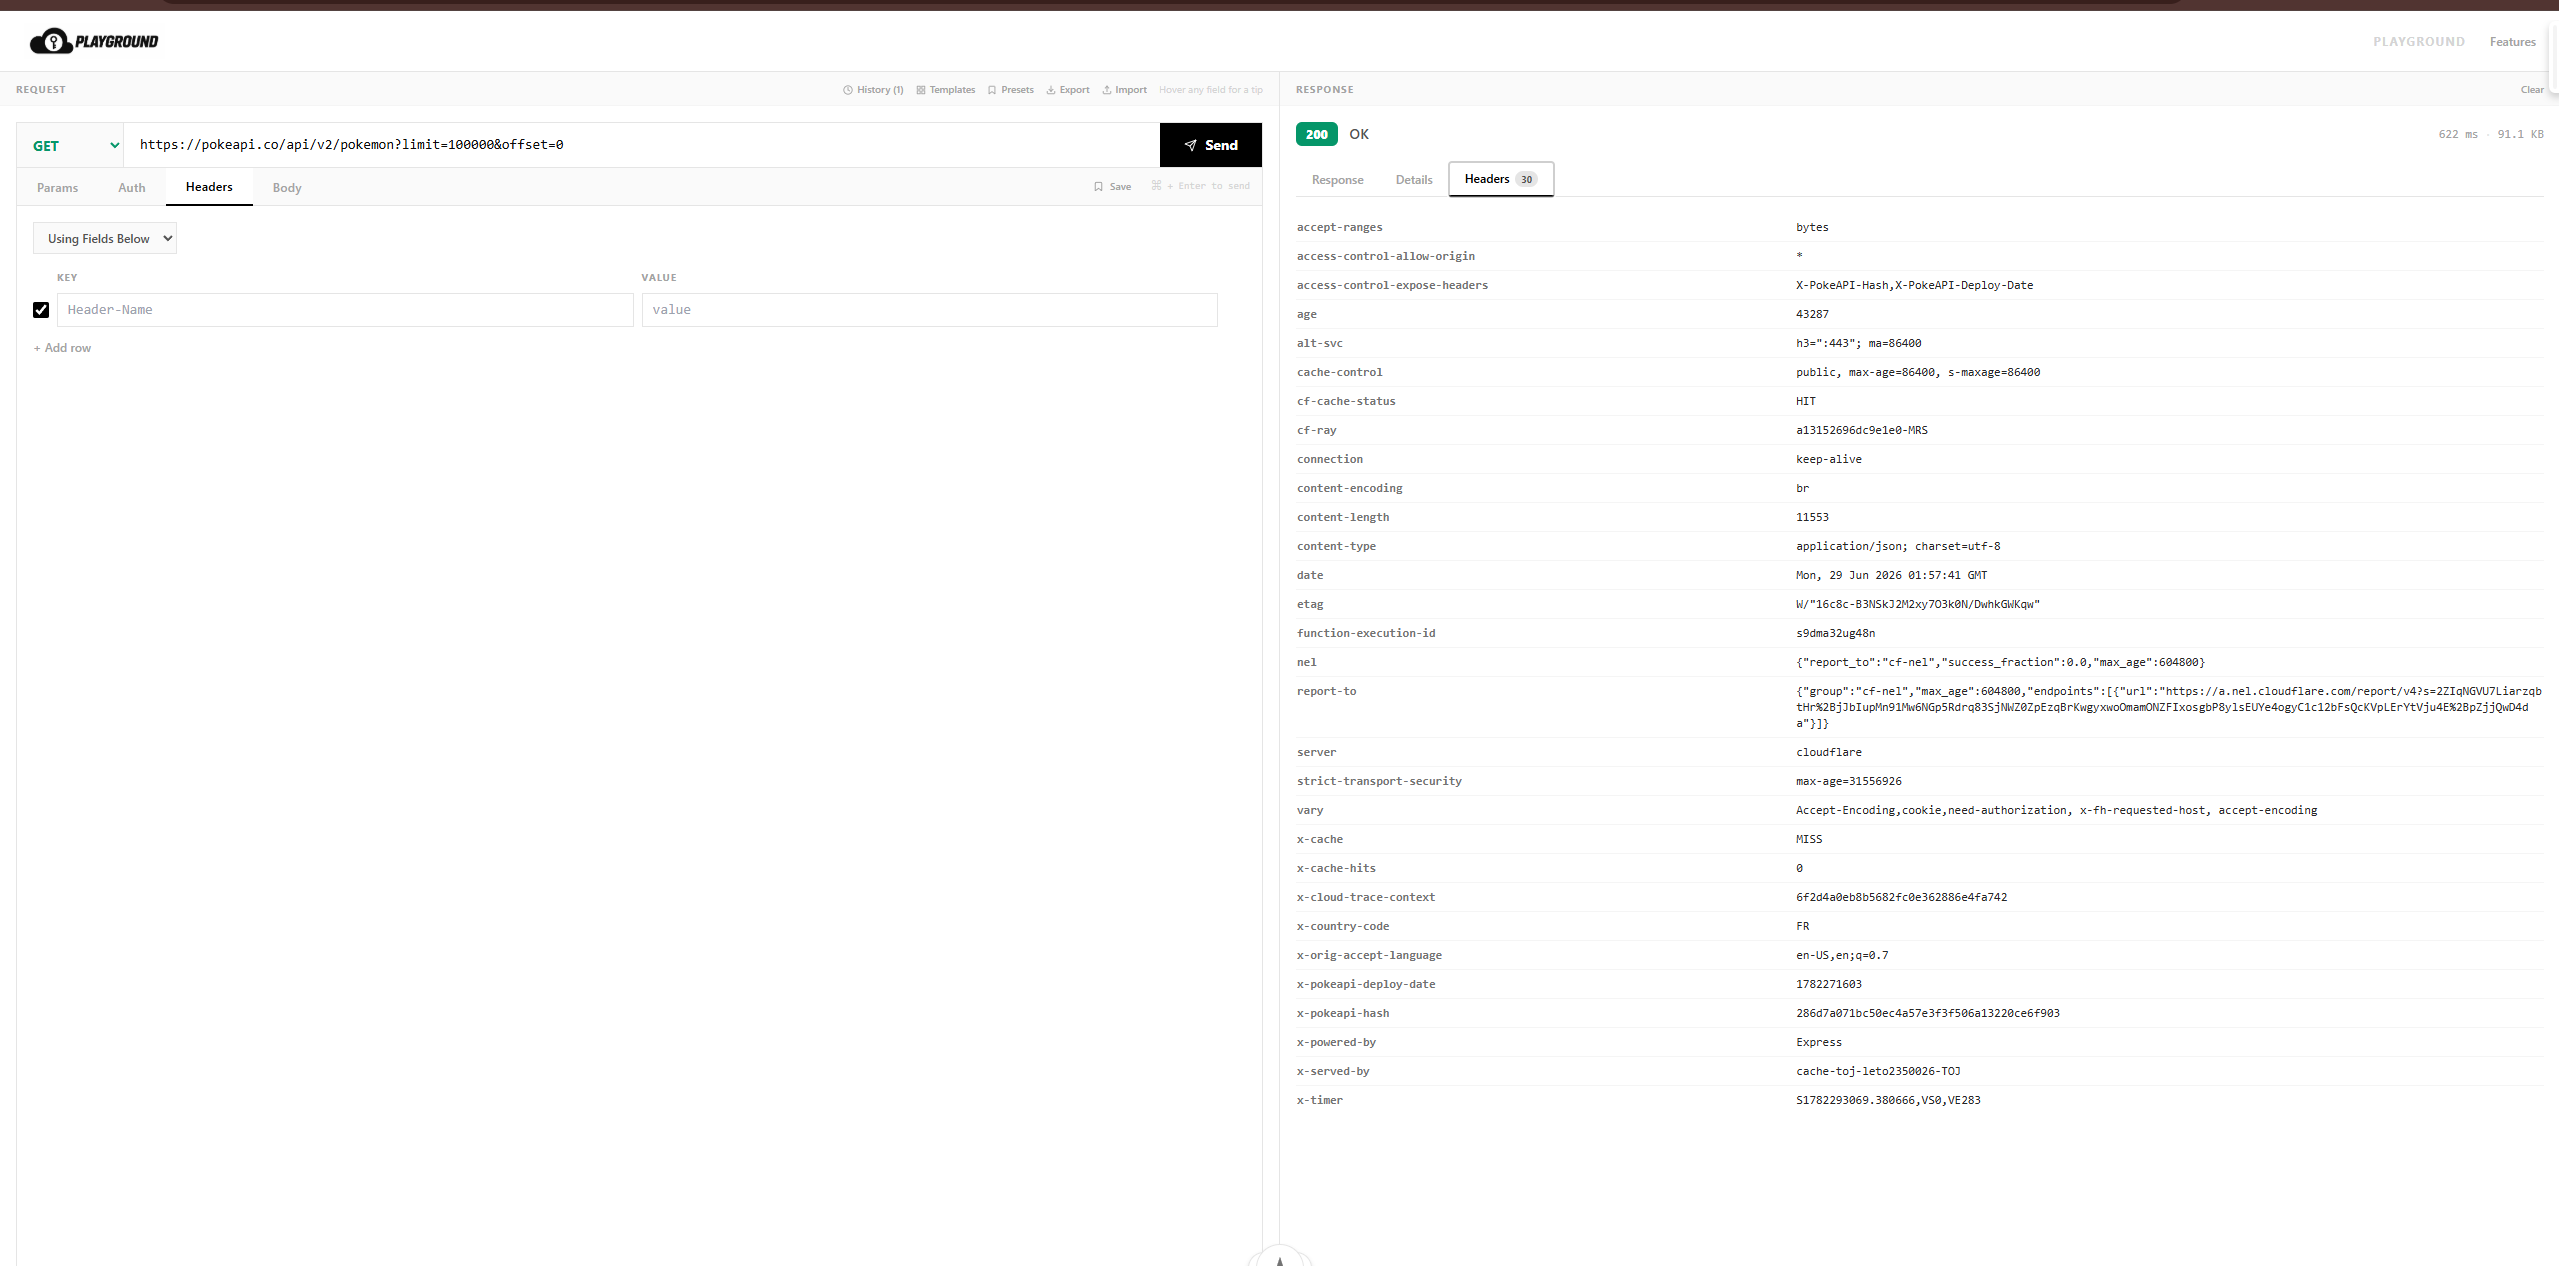
The Headers tab is useful when the response body looks fine but you still need lower-level clues like content type, cache behavior, server metadata, or exposed API-specific headers.
That is the happy path. But debugging becomes useful when something breaks.
#What If the Pokemon API Request Fails?
Try changing the path to a route that does not exist:
https://pokeapi.co/api/v2/pokemons?limit=10000&offset=0The tiny difference is easy to miss: pokemon became pokemons.
If the API returns a 404, the debugging workflow becomes straightforward:
- Response: The status code tells you the resource or route was not found.
- Request: The debug view shows the actual path sent:
/api/v2/pokemons. - Fix: Compare that path with the working route and change it back to
/api/v2/pokemon.
This is where an AI-powered debugger becomes useful. Agent Mode can inspect the same request details, query params, response status, and response body, then point out the likely issue in plain English:
The request is reachingpokeapi.co, but the path appears to be incorrect. Try/api/v2/pokemoninstead of/api/v2/pokemons.
That saves you from scanning the whole request manually. You still get the raw evidence in the debug view, but the AI agent helps turn that evidence into a likely fix.
#Example: Debugging a Broken 422 Response
Imagine you send this request:
POST /v1/customers HTTP/1.1
Host: api.example.com
Authorization: Bearer abc123
Content-Type: application/json{
"email": "mira@example.com",
"birthday": "12-04-1998",
"tier": "premium_plus"
}The API returns:
{
  "error": "validation_failed",
  "details": [
    {
      "field": "date_of_birth",
      "message": "This field is required."
    },
    {
      "field": "tier",
      "message": "Must be one of: free, pro, enterprise."
    }
  ]
}
Now apply the three steps:
- Response: The status is
422, so the body was understood but failed validation. - Request: The body uses
birthday, but the API expectsdate_of_birth. The tier value is also invalid. - Isolation: Auth and endpoint are probably fine because the API reached validation.
The corrected request is:
{
  "email": "mira@example.com",
  "date_of_birth": "1998-12-04",
  "tier": "pro"
}
That is API debugging at its best: no guessing, no panic, just evidence.
#Where API Playground Fits
You can debug API responses with cURL, browser devtools, Postman, code, or logs. The process matters more than the tool.
But the tool can make the process faster.
API Playground is built for quick request and response debugging:
- Paste an endpoint and send a request from the browser.
- Edit methods, headers, params, auth, and body in one place.
- Inspect status, response headers, and formatted response body.
- Quickly test minimal requests.
- Compare how the response changes after each adjustment.
- Use it without installing a desktop app or creating an account.
#How the AI Agent Helps You Debug and Fix the Issue
The Details view gives you the raw evidence. Agent Mode helps turn that evidence into a fix. If you want a deeper walkthrough of the AI workflow, read our guide to AI API testing with Agent Mode.
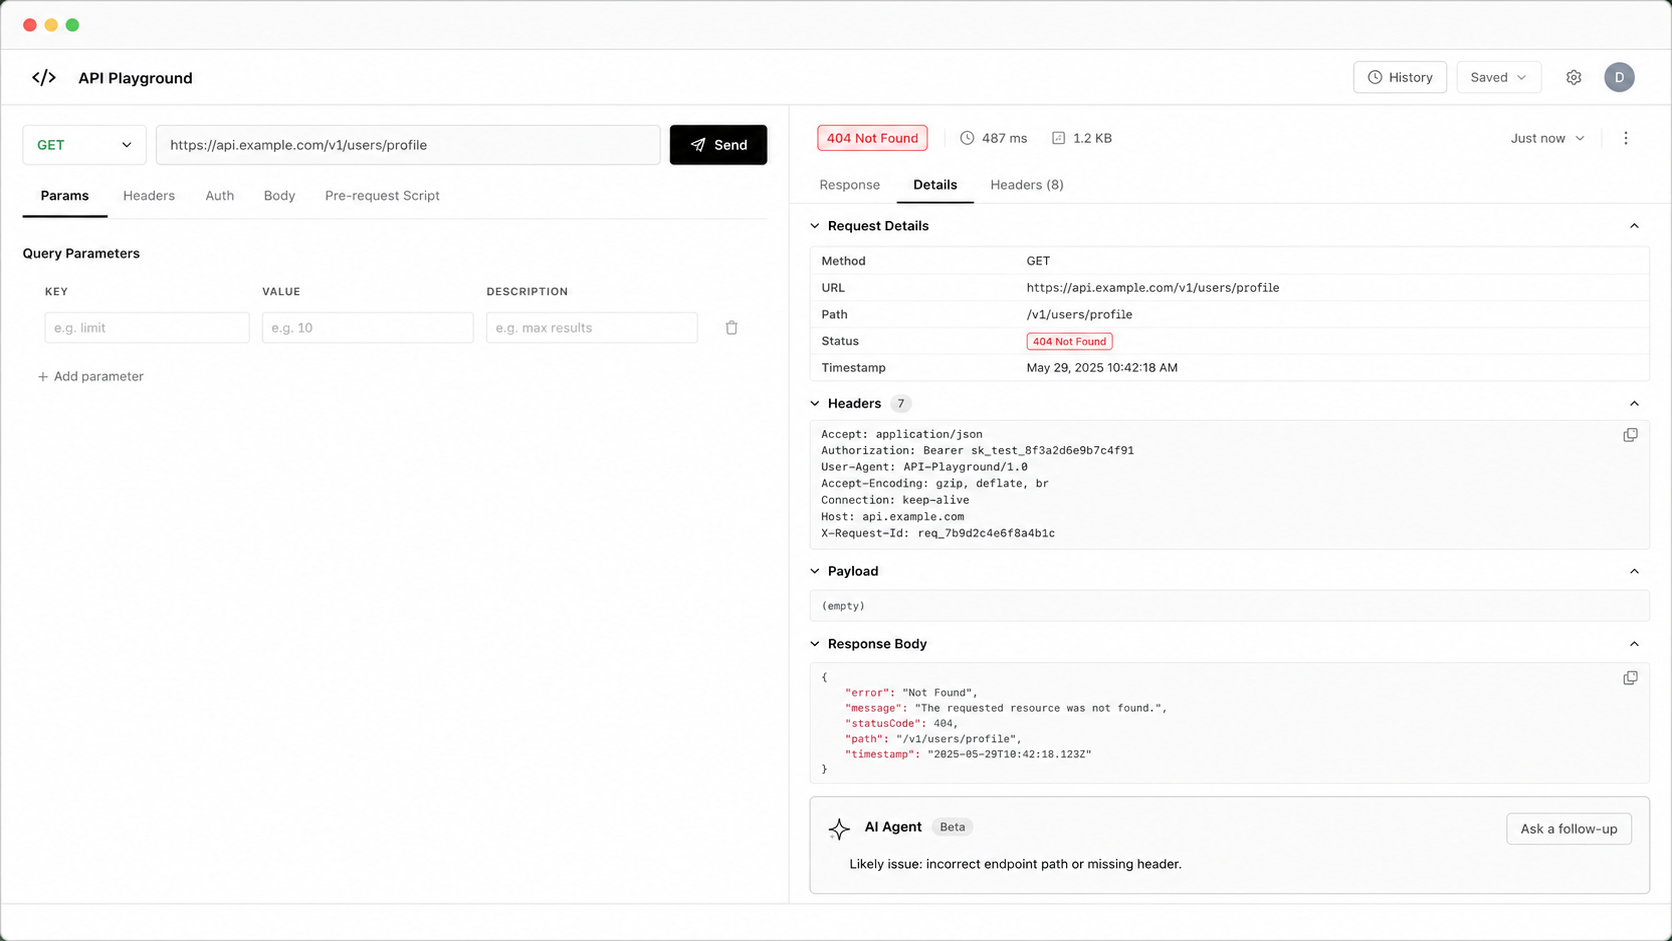
When a request fails, the AI agent can look at the same things you would normally inspect manually:
- the HTTP method and final URL
- query params
- request headers
- auth setup
- payload/body
- response status code
- response headers
- response body and error object
Then it can explain the likely cause in plain English. For example, instead of making you stare at a 422 response and guess which field is wrong, the agent can point to the missing field, wrong enum value, invalid date format, or header mismatch that caused the failure.
That means the workflow becomes:
- Send the request in API Playground.
- Open the debug view to see exactly what happened.
- Ask Agent Mode to explain the failure.
- Apply the suggested fix to the URL, headers, auth, params, or payload.
- Send again and compare the new response.
The important part is that the AI agent is not guessing from a vague error message. It has the request and response context needed to reason through the issue.
For broken API responses, that speed matters. The less time you spend fighting setup, the more time you spend finding the actual cause.
#When You Need Full-Stack Tracing
API Playground helps you debug the request you are sending right now: the URL, headers, payload, response body, response headers, status code, and AI-powered fix hints.
Sometimes the problem is deeper. The request leaves your browser correctly, but then fails somewhere inside your backend, proxy, GraphQL resolver, database call, or another internal service. That is when full-stack tracing becomes useful.
For local development, Envy by FormidableLabs is an open-source Node.js telemetry and network viewer that traces network calls across apps in your stack. It is useful when you want to see how a request moves through a Node.js backend, Express server, Apollo layer, or Next.js server during development.
For production-grade observability and distributed tracing, OpenTelemetry is the open-source standard to know. Its tracing docs explain how traces and spans help you follow a request as it moves through multiple services, which is exactly what you need when one API call touches several systems before returning a response.
The practical workflow is:
- Use API Playground first to confirm the request and response are correct at the HTTP boundary.
- Use Agent Mode to reason through the status code, headers, payload, and returned error.
- Use open-source tracing tools like Envy or OpenTelemetry when the bug lives deeper in the application stack.
#Final Takeaway
A broken API response is not the end of the trail. It is the start of the investigation.
Debug it in this order:
- Read the response.
- Verify the request.
- Isolate the root cause.
That simple loop keeps you from guessing, changing too many things, or blaming the wrong system.
The next time an API returns a weird status code, empty body, validation error, or unexpected JSON shape, open API Playground, reproduce the request, and walk through the three steps. Then use Agent Mode to explain the failure and help you fix the request faster.
#Related Guides
- [How to Test an API in Under 5 Seconds](/blog/how-to-test-api-in-under-5-seconds) — If you're new to API testing, start here first. This guide walks through reproducing any HTTP request in your browser in under five seconds — a key skill before you can effectively debug failures.
- [Best Postman Alternative for Developers](/blog/best-postman-alternative-for-developers) — Comparing tools? See how API Playground stacks up against Postman, Insomnia, Bruno, and others on setup time, memory, and debugging ergonomics.
- [AI Agent API Testing Guide](/blog/ai-agent-api-testing-guide) — Go deeper on Agent Mode. This full tutorial covers how GPT-4o diagnoses 401, 403, and 422 errors, auto-builds request bodies, and runs multi-step OAuth flows autonomously.
- [How to Test a Gemini API Key Without Writing Code](/blog/how-to-test-gemini-api-key-response-without-writing-a-single-line-of-code-in-under-1-minute) — AI API errors have their own quirks. This guide shows how to test and diagnose Gemini API key responses in the browser without writing any code.